Mobile eCommerce Shoppers
In 2013, Internet and mobile measurement firm comScore began detecting a new trend in e-retailing: the mobile-only shopper. By January 2015, some top retailers were seeing an explosion in customers who only access their digital properties using smartphones and tablets (Source: comScore).
% of time spent with online retail on smartphones and tablets
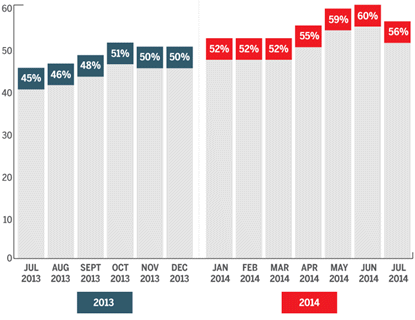
“Mobile is now the primary access point to online retail for most consumers,” says Andrew Lipsman, vice president of marketing and insights at comScore. “As a result, retailers really need to rethink how they deliver their online shopping experience” (Source: comScore).
According to Branding Brand who has measured traffic to its leading retailer clients for years, the tipping point came in August 2014, when 51% of retail traffic stemmed from smartphones and tablets.
The percentage of retail traffic, mobile versus desktop, 2011-2014, ending in August 2014
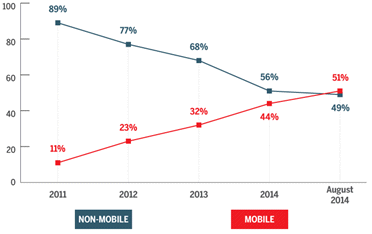
The Shopgate Mobile Commerce Index is a monthly look, exclusive to Internet Retailer, at mobile commerce platform provider Shopgate’s 5,500 retailer clients worldwide. Clients use a mix of smartphone sites, tablet sites, smartphone apps and tablet apps (Source: Shopgate).
The mobile average order
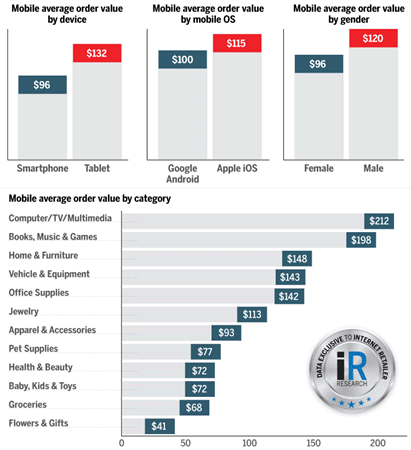
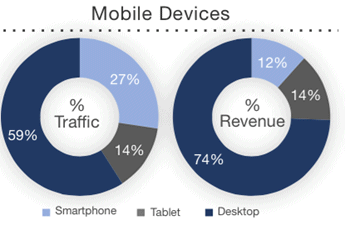
Smartphones drove 33.7 percent of all online traffic compared to tablets at 12.4 percent, making it the browsing device of choice. When it comes to making the sale, tablets drove 12.4 percent of all online sales while smartphones accounted for 10.7 percent. Tablet users also averaged $98.56 per order, versus smartphone users, who averaged $92.37 per order (Source: IBM Digital Analytics Benchmark).
Mobile eCommerce Conversions
In 2011, web sales of web-only e-retailers surpassed web sales by retail chains. The gap has continued to widen as the web sales of web-only retailers grow at a much faster rate than retail chains (Source: Top500Guide.com).
Since Black Friday 2014 e-retailers have come to recognize that smartphones are now a major force in online shopping, showing tremendous growth in smartphone traffic but more limited growth in smartphone transactions (Source: MarketLive).
According to the company’s Q1 report (drawn from its client base):
- Smartphone visits grew by 269 percent over Q1 2014, which was 27 percent of total traffic
- Smartphone orders were up 104 percent, and reached 13 percent of all transactions
Overall mobile devices (including tablets) represented 41 percent of traffic in Q1 2015 generating 26 percent of total e-commerce sales (Source: MarketLive).
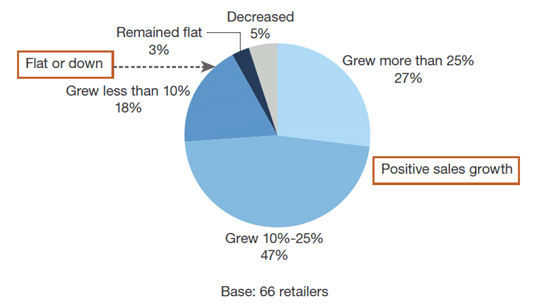
Among 71 retailers surveyed, 74 percent said their 2014 web sales climbed 10 percent or more compared to 2013, and 27 percent of respondents said they experienced more than a 25 percent increase in online sales (Source: Shop.org’s “State of Retailing Online 2015? survey).
Along with e-commerce sales, the survey shows many respondents reported increases in a number of areas, including site conversion rates, repeat customer rates and average order values. Of the survey participants, 71 percent reported a rise in website conversion rates, 52 percent said their repeat customer rate was up, and 46 percent said average order values increased, with the average dollar amount for AOVs totaling $171.
The eCommerce Shopping Cart
47% of consumers ages 18-34, and 37% of all shoppers, intentionally leave items in an online shopping cart in hopes that the retailer will come back with a better offer (Source: Shop+, the retail unit of Mindshare North America).
70% of millennials and 59% of adults overall search the web for promo codes before they purchase anything online (Source: Shop+, the retail unit of Mindshare North America).
Sending follow-up emails to consumers who leave items in shopping carts can be an effective tactic, as many of them do come back and buy. The conversion rate on those types of emails averaged 21.73% last year (Source: Listrak).
The Power of eCommerce and Social
Consumers who arrived from a share or a social network saw an average spend of $126.12 on average, compared to non-social orders of $116.55 — an increase of 8.2% (Source: AddShoppers).
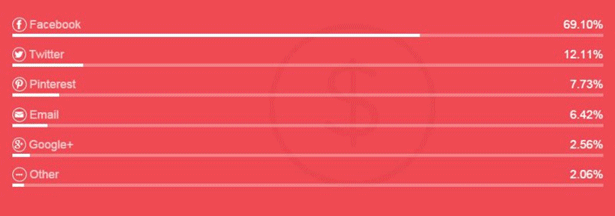
The average share leads to $2.56 of sales on average but is highly dependent on the source of the share. A share via email generated the most revenue with $12.41 coming on each share. Pinterest on the other hand led to the lowest dollar amount per share at 67 cents per share. Google+ surprising lead the social networks with an average of $5.62/share while Twitter saw $1.03/tweet and Facebook saw $0.80/share. While the value of the shares varies wildly, the volume does as well. AddShoppers found that while Facebook had a lower amount of revenue per share, it had far and away the highest revenue driven of the networks (due to the volume of sharing).
